- Laura Rogers
- Friday, November 13, 2020
Help your second or third-grade students learn about measurement and data analysis!
Exploring the standards for measurement and data analysis is perhaps more fun than any other math standard, at least at my house! Measurement skills can be taught in all sorts of fun ways through cooking, crafting, and playing with blocks. Data analysis also has unlimited potential for fun. Sorting and graphing candy pieces like M&M’s or Skittles, using a pizza to illustrate a pie graph, or creating a chart to graph what everyone found on a nature walk are all ways to make math concrete and enjoy learning together at the same time.
Measurement and Data Analysis: Estimate and Measure Lengths
What are the standards for second grade and how will I know if my child can meet them? Your child has met the measurement and data analysis for second grade when:
• My child can use suitable tools to measure the length of an object.
• My child can measure an object using various lengths (foot/yard) and explain why the measurements differ.
• My child can estimate and measure in everyday units (inch, foot, yard, centimeter, and meter) and determine how much longer one object is from another.
• My child can sort and classify items into four categories and represent the “data” using picture and bar graphs.
• My child can produce data by measuring objects and organize the data on a horizontal line plot.
• My child can tell time to the nearest five minutes and use a.m. and p.m.
• My child can solve real-world problems using dollar bills with the $ symbol and using coins with the ¢ symbol.
Measurement and Data Analysis: Objects' Area, Perimeter, and Volume and Reading Graphs
What are the standards for third grade and how will I know if my child can meet them? Your child has met the measurement and data analysis for third grade when:
• My child can tell and record time to the nearest minute and solve time problems within the hour using addition and subtraction.
• My child can estimate and measure liquid volume (for example, pint, gallon, milliliter, liter).
• My child can create and read scaled bar graphs and line graphs to represent collected data.
• My child can understand the difference between area and perimeter and how to measure each.
• My child can solve real-world problems involving the perimeter and area of shapes with straight sides.
Activities and Multimedia
Let's learn about tally charts and bar graphs with BrainPOP Jr.
How do liquids measure up? How many liters in a gallon? Let's find out.
Activities:
Check in with Frogs, Fairies, and Lesson Plans for some ideas on how to have fun exploring measurement.
All About Third Grade shares these fun ideas for exploring graphs.
Check out this free bar graph template you can download at Teacher's Pay Teachers.
Meraki Lane has compiled a list of kid-friendly recipes that help kids explore measurement as they create yummy things to eat.
Looking for more resources to teach the SC Education Standards? Visit the SC Education Standards page.
Books to Read:
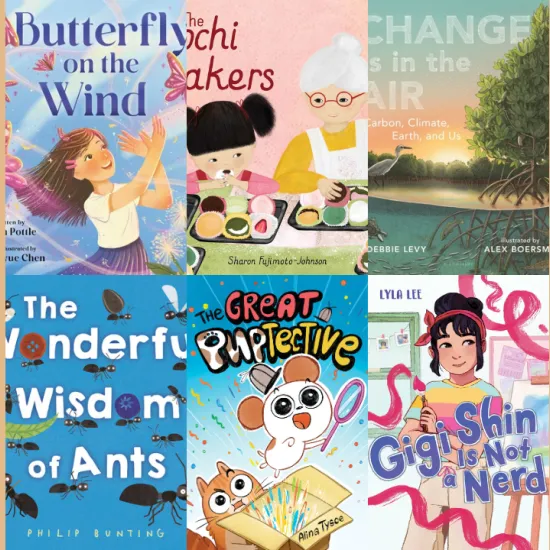
The titles below will help you and your child learn about measurement and data analysis. Want us to pull books for you? Contact us at 803-799-9084 and request to have books sent to your nearest Richland Library location.

Money Math

Telling Time

Graphs

Bar Graphs

Pictographs


How Long or How Wide?


Earning Money

Measuring

Telling Time with Big Mama Cat

Tally Cat Keeps Track.


Measuring Sizes

Measuring Weight and Time

About Time

The Great Graph Contest

Measuring Penny

Great Graphs and Sensational Statistics


Discovering Graph Secrets

Telling the Time

Lemonade for Sale


Sir Cumference and the Off-the-charts Dessert

Telling Time

Graphing Weather and Climate

How Do We Measure Matter?


Area, Distance, and Volume

Graphing the Universe


